Brutal Honesty Callout. Here is the truth most GTA buyers do not want to hear: Not every property lost value the same way in 2025. The biggest drops hit freeholds hard in some places, barely touched others, and the pattern was nothing like what you were told last spring. This year, the gta housing market 2025 is a study in steep differences, even across just a few blocks. If you are sorting through falling house values or worried about a neighbour’s panic sale, you are not alone. You need facts, not general headlines.
The Opportunity: Reading Between the Lines in 2025
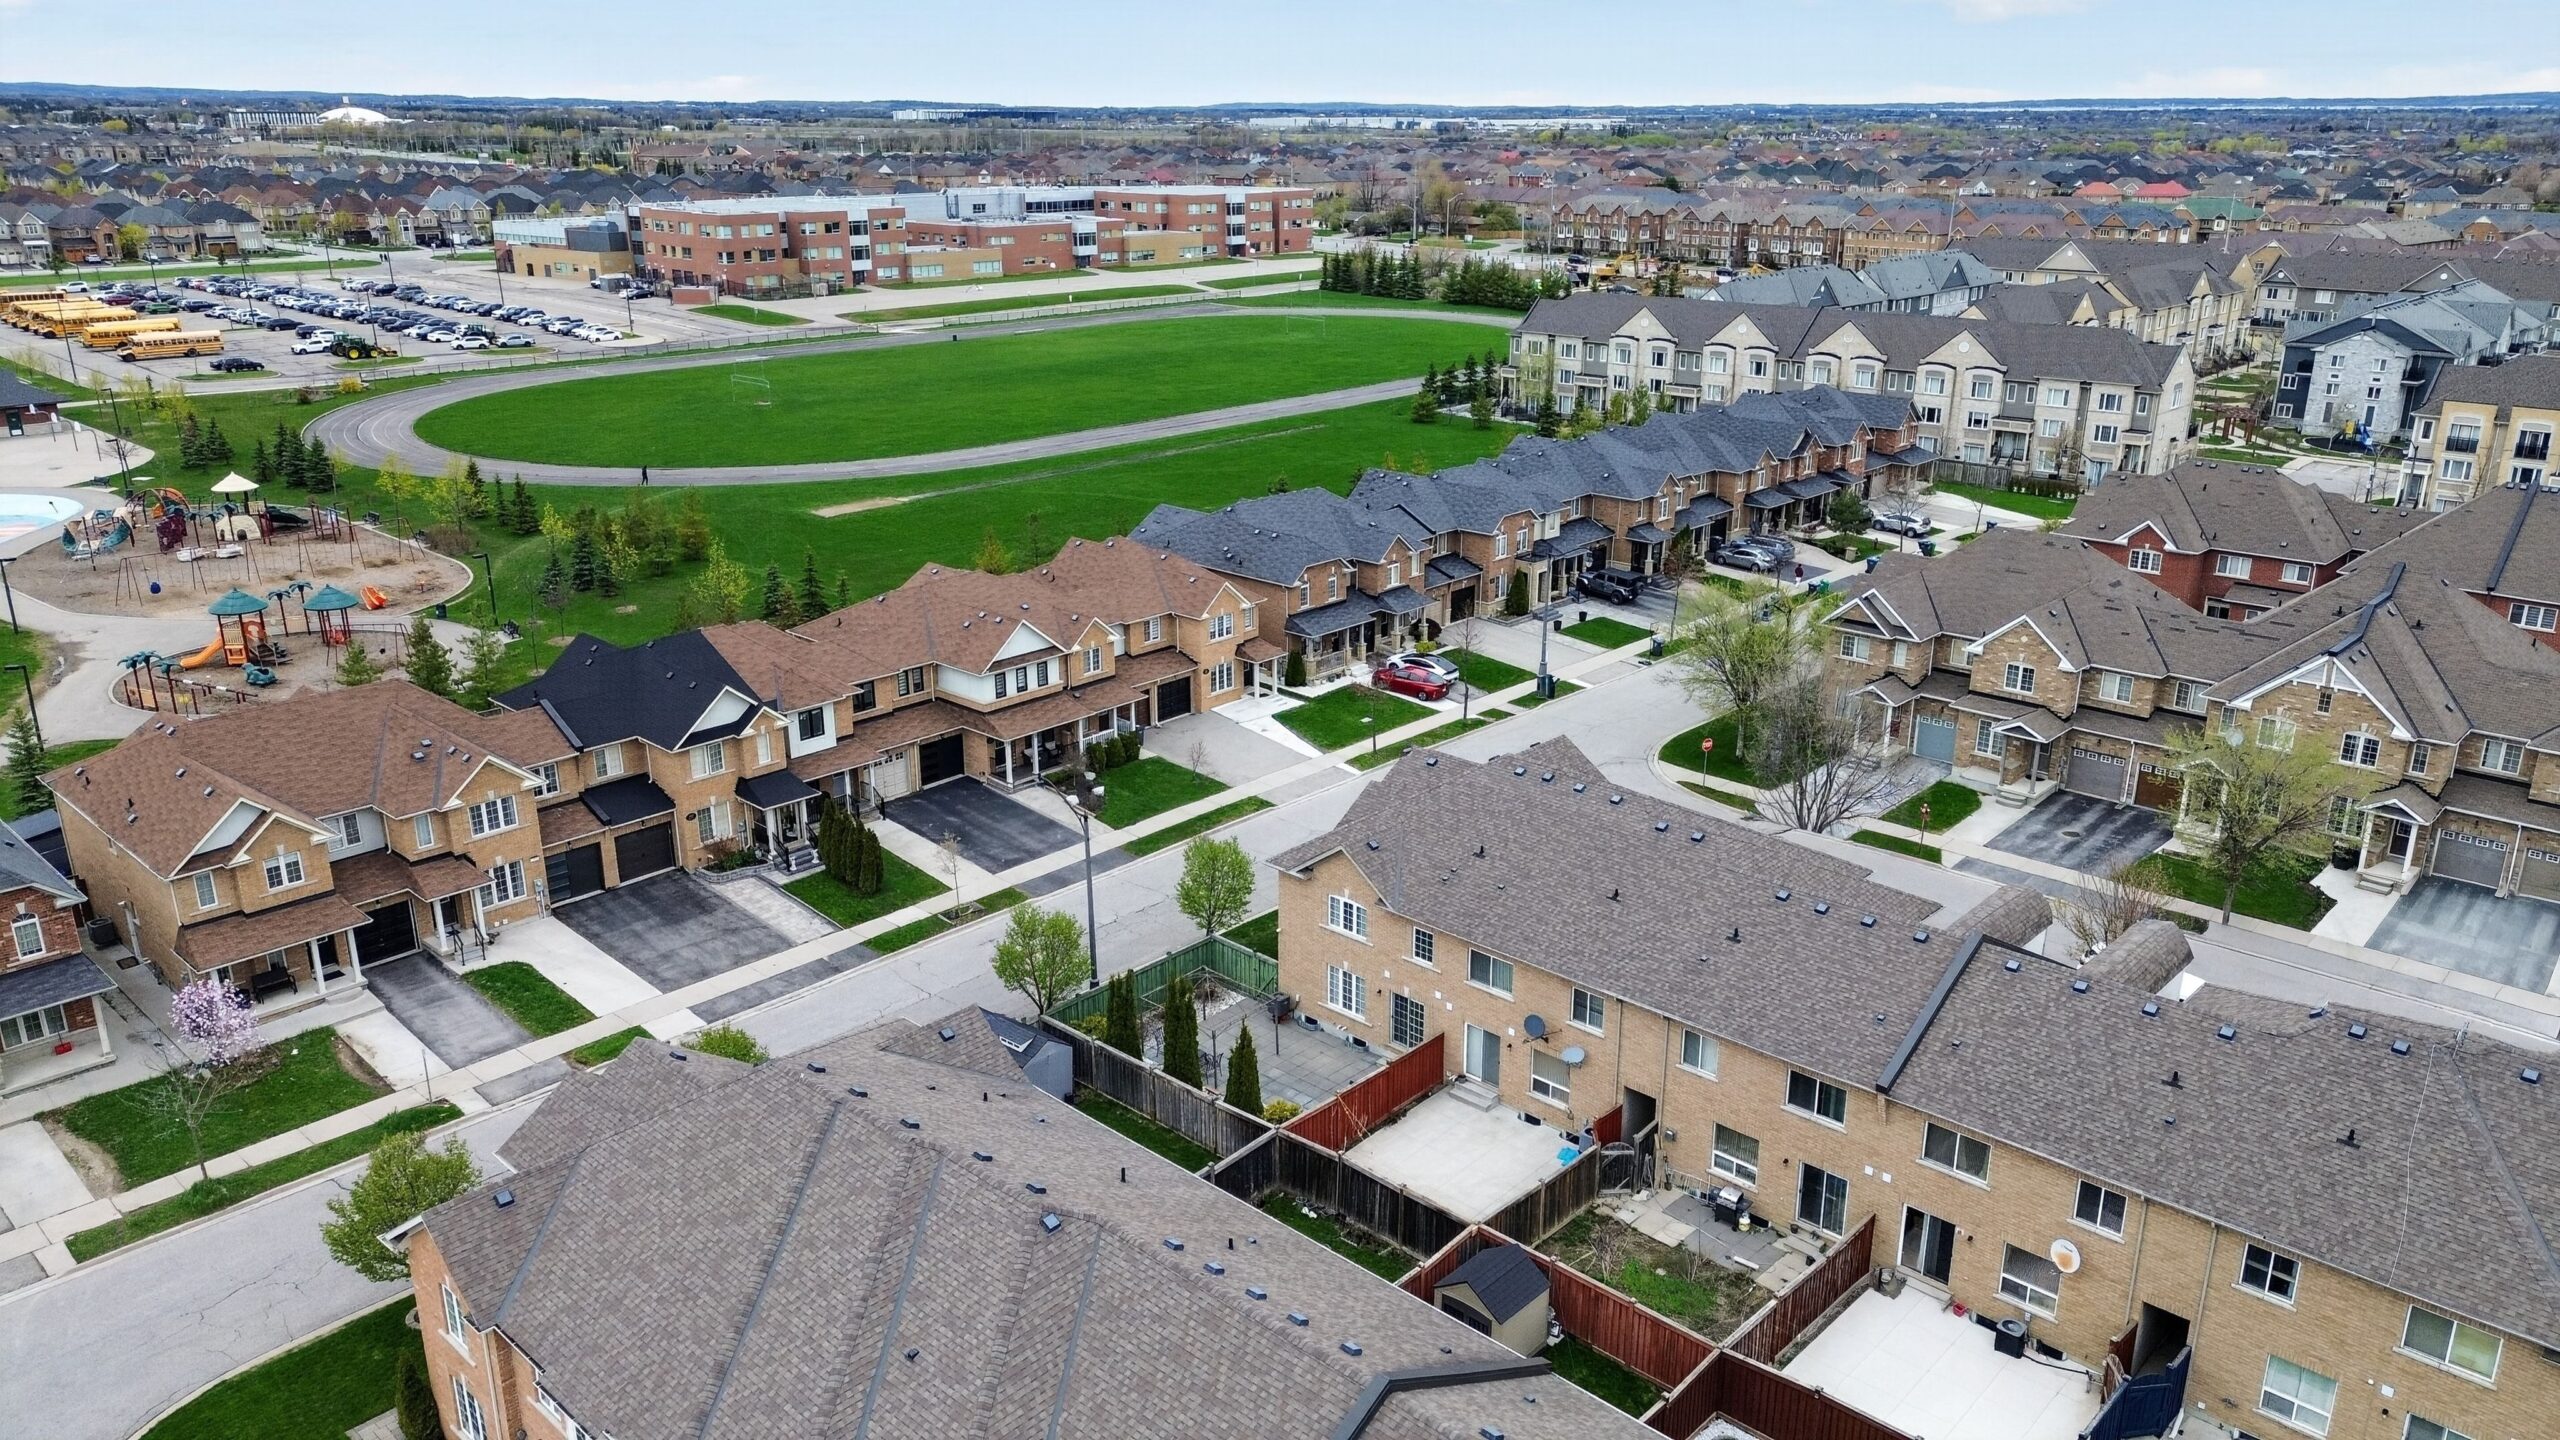
Sellers and buyers are both feeling it. Detached homes in Brampton, semi-detached in Oakville, and townhouses in Vaughan all shifted differently. This year, if you picked right or wrong, you could see a gap of $200,000 between identical homes in the same city. Last year, the market moved mostly as one. Now, price changes are wildly local. A detached in northwest Brampton dropped nearly 14 percent since last January. Meanwhile, a similar place ten minutes down the highway in Halton Hills barely budged by 4 percent.
The opportunity is simple and harsh: If you are watching closely, you will see buyers snag homes in collapse spots for prices not seen since 2021, while sellers who ignore the data can lose six figures.
The list of the top 10 freehold price drops shows exactly where the floor fell out, and where it stayed firm. But there is a twist to these numbers, and that is what most people miss.
The Problem: Why Most People Miss the Real Story
The advice you hear is often too broad. “Freeholds are down, condos are next.” Or “The suburbs are riskier than Toronto.” Sometimes you get the old real estate standby: “The market always recovers eventually, just wait it out.” But in 2025, none of that fits what is on the ground.
Here is the fence: If you follow popular advice and look at city or even neighbourhood averages, you will miss the true landmines. Some pockets saw detached prices tumble by $250,000 from early 2024 peaks. Others, literally a few turns away, saw losses of less than $30,000. For example, Milton’s Clarke neighbourhood detached homes dipped just 6 percent, but nearby Harrison tumbled nearly 12 percent in a shorter window. The wrong choice is not just about property type, but micro-location and timing.
Thinking about selling your home?
Get a free, no-pressure valuation from a GTA realtor who tracks this market every day.
Another problem is the myth of the “safe” GTA suburb. Hamilton and Brampton absorbed outsized hits in their outermost new-build clusters, while older streets near schools and transit fared far better. If you lump everything together, you miss both the deals and the danger.
People keep refreshing listings, seeing price drops, but make the same buying and selling mistake: thinking the average tells the full story. But the cost of inaction is real: If you chase after the wrong “cheap” area, you risk another 5 to 8 percent drop before values stabilize. That’s $60,000 on a $750,000 house.
This sets up the real question, how do you spot the real opportunity (or the real risk) before everyone else?
GTA Freehold Price Drops 2025: What Makes or Breaks a Sale
The solution comes from getting specific. The top 10 freehold price drops in the GTA this year tell a clear story. It is not just about the city, but the niche: street, style, and seller urgency. For example, a Vaughan semi on Kipling saw its benchmark drop to under $980,000, the lowest since late 2021. In North Oakville new-build townhomes, values fell by more than 13 percent in just seven months, wiping out all gains since pandemic buying peaks.
Meanwhile, larger detached homes in Caledon’s fully built subdivisions lost more than $300,000 in median sale price compared to summer 2024. But Caledon’s century home pockets and places near Mayfield avoided most of this, down roughly 5 percent. The story repeats in Brampton, Mount Pleasant’s three-storey towns slid the most, while well-kept detached homes near schools moved within 30 to 45 days at only a 6.5 percent discount from last year’s highs.
This year showed why seeing past the “city average” matters. By digging into the real numbers, you avoid getting blindsided, or missing your chance. Individual sellers who tried to ride out the storm often dropped their price three times and sold late, losing out compared to neighbours who priced for the new reality.
So you can avoid being the last house standing when buyers evaporate. Or if you’re buying, land a deal without stepping on a price trap that still has further to fall.
If you want more context on how these drops compare to condo trends, or want to see what’s happening across property types, see these breakdowns in GTA Suburbs Home Price Drops: 8 Areas Where Values Have Collapsed and the Toronto Condo Market 2026: Which Condos to Avoid Buying.
The Payoff: What You Really Get from This Approach
The whole benefit of slicing through the old city-level stats is this: you buy or sell based on today’s facts, not noise. So you can:
- Move on a house in a high-drop zone and pay true 2021 pricing, so you can capture value that others think is gone for good.
- Avoid the loss spiral of chasing a falling market, so you can sell before your property loses another 5 percent.
- Spot where buyer interest is still strong (like certain Milton and Brampton family enclaves), so you can set a price that attracts offers in 30 days instead of 80.
Missing the nuance can cost you the opportunity to upsize for less, or force you to accept a painful sale when you could have pivoted. It is like fishing after a storm: you need to know exactly where the big catch lingered, not just what “the lake” is doing overall.
That is how people lost $100K on the wrong deal while others found relative safety one neighbourhood over. This year, sharper moves beat waiting for the “market” to turn.
How to Apply This to Your Own GTA Real Estate Moves
The system is simple, follow the steps:
- Get hyper-local. Start with the property type and neighbourhood, not just the city name. Focus on the actual street sales, not headline numbers.
- Track time on market. A place lingering over 50 days now is a signal, buyers are hesitant for a reason.
- Read price cut patterns. Multiple drops in 30 days almost always mark a segment where the floor is still moving, not yet stable.
- Compare to last local peak. Use real monthly data, see how far prices have come down since spring or summer 2024, not just year-over-year comparisons. The big drops cluster in neighbourhoods that spiked highest last cycle.
- If you do not have access to this breakdown, partner with someone who pulls local data every week. General info will not be enough.
For buyers: Know which zones are still dropping and which have flattened. For sellers: Price to the leading edge, not trailing comps from six months ago. This is the difference between a 30-day sale and chasing the market down. If you want context on what types of homes sellers struggle with most, see the crisis in Power of Sale Listings GTA: Why They’re Rising Fast in 2026.
Next Steps: See Where You Stand in the GTA Housing Market 2025
Every neighbourhood in the GTA housing market 2025 is telling its own story right now. If you want the top 10 biggest drops, you need someone laser-focused on the numbers, street by street. I report on these shifts as a GTA real estate agent. If you want to see what your home could sell for today, or where the opportunity is in your buying zone, check the latest data at matsmoy.com or contact me to get your local update.
Want this on your specific block
If you want to know what this means for your home or your search, send me a note. You can book a fifteen minute call, or run a free home valuation and I will send the recent comps for your street. I cover the Toronto market every week, so I can tell you what the data is doing in your neighbourhood before you make a move.

Sales Representative | Robbio Nicolle Real Estate Team at Real Broker Ontario
Halton Hills realtor covering Georgetown, Milton, Mississauga, and the wider GTA. Data-first, no hype. Featured on YouTube at The Market with Mats Moy with 500K+ views.