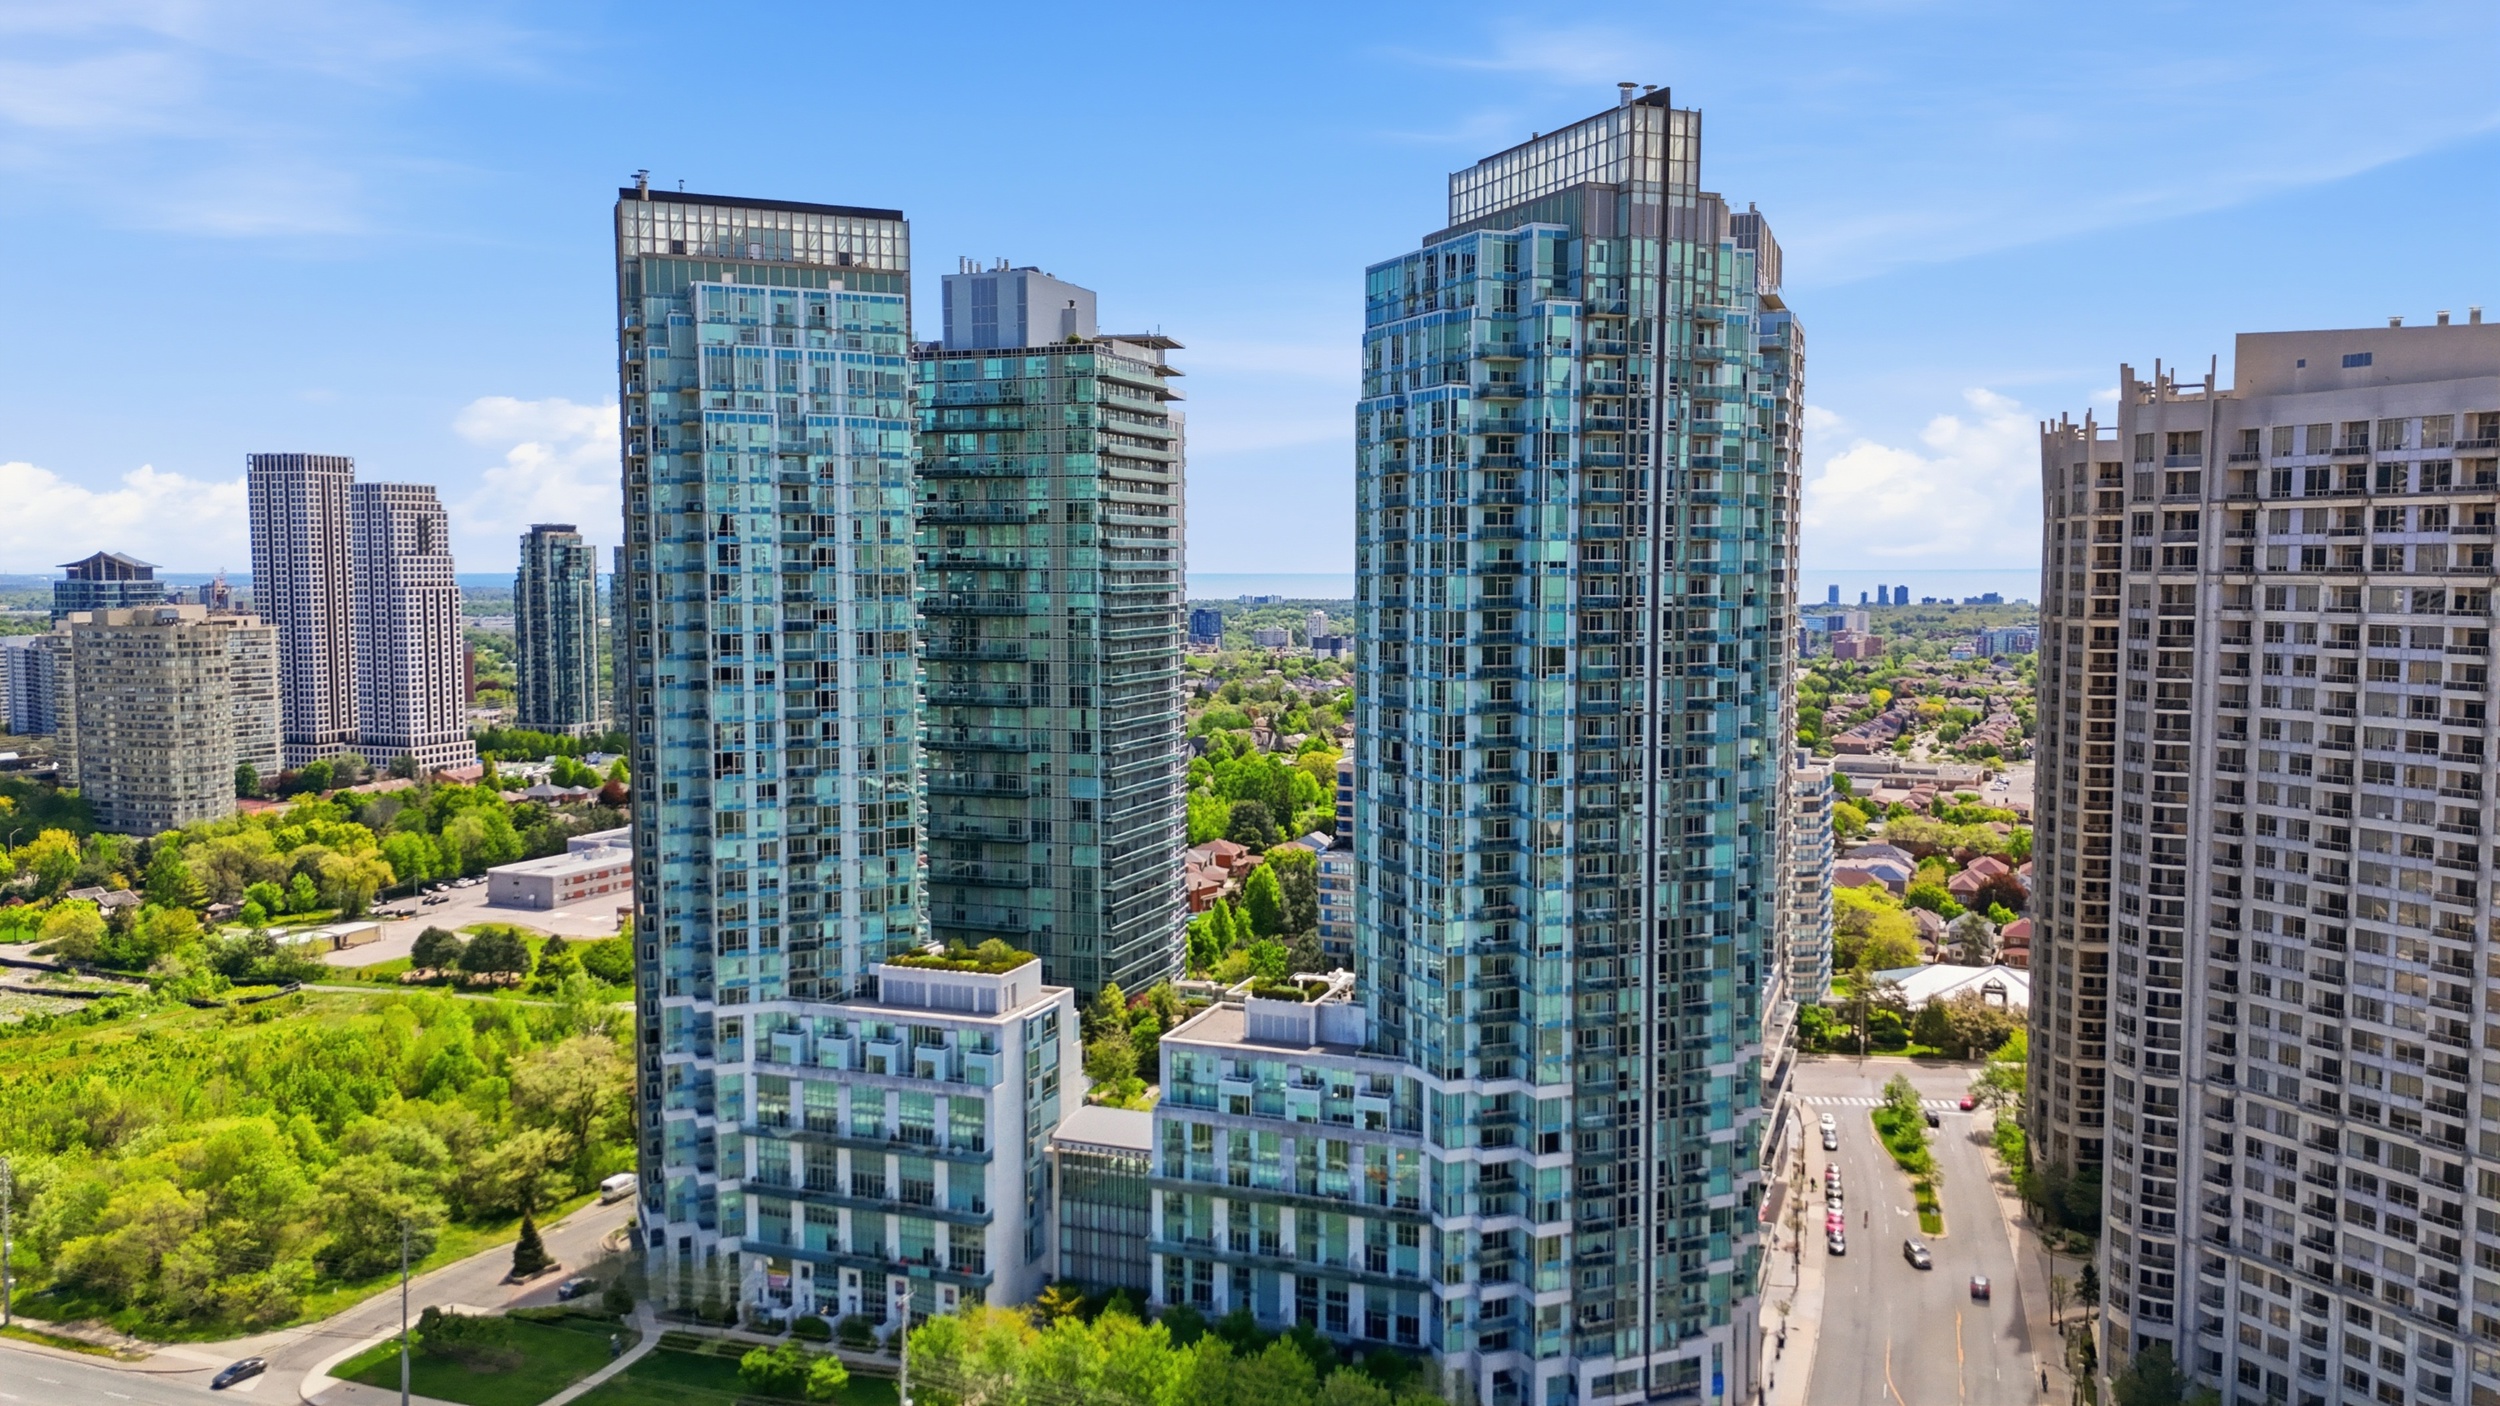
Hook formula: Curiosity Gap. You might think you know which Toronto neighbourhoods are cooling off right now, but the district data I pulled this week reveals something that almost nobody expects. The W10 area, often seen as a safe bet, looks weaker, and for reasons different from the usual suspects. If you’re tracking toronto district real estate, especially across Etobicoke, High Park, and Scarborough, the map looks a little off this season.
What’s Happening in Toronto District Real Estate Right Now?
Toronto is made up of twenty-eight different real estate districts. Each tells its own story. Three stand out this month: W10 (Etobicoke’s western pocket), W01 (High Park/Swansea), and E07 (Agincourt North in Scarborough). Sales are down in all three, and prices have dropped year-over-year. But they’re not all dropping for the same reason. For anyone buying or selling, this is the best real-time peek behind the curtain you’ll get.
Take W10 first. Home prices have fallen over 10 percent from last year’s average, one of the highest drops across Toronto. In High Park’s W01, the number of sales is actually up 69.2 percent year-over-year, but prices slid nearly 13 percent compared to spring 2023. In E07, Agincourt North, houses are sitting much longer, and the price drop is almost 18 percent, outpacing even the western suburbs.
This isn’t just a case of ‘the whole city is softening.’ Different patches are moving for different reasons, sometimes opposite directions at street level.
The district snapshot opens up a question: why is stable Etobicoke suddenly so shaky, and what makes E07 so different? Up next, I’ll unpack what’s missed if you only follow the headlines, not the neighbourhood numbers.
The Real Problem: Headlines Hide the Local Truth
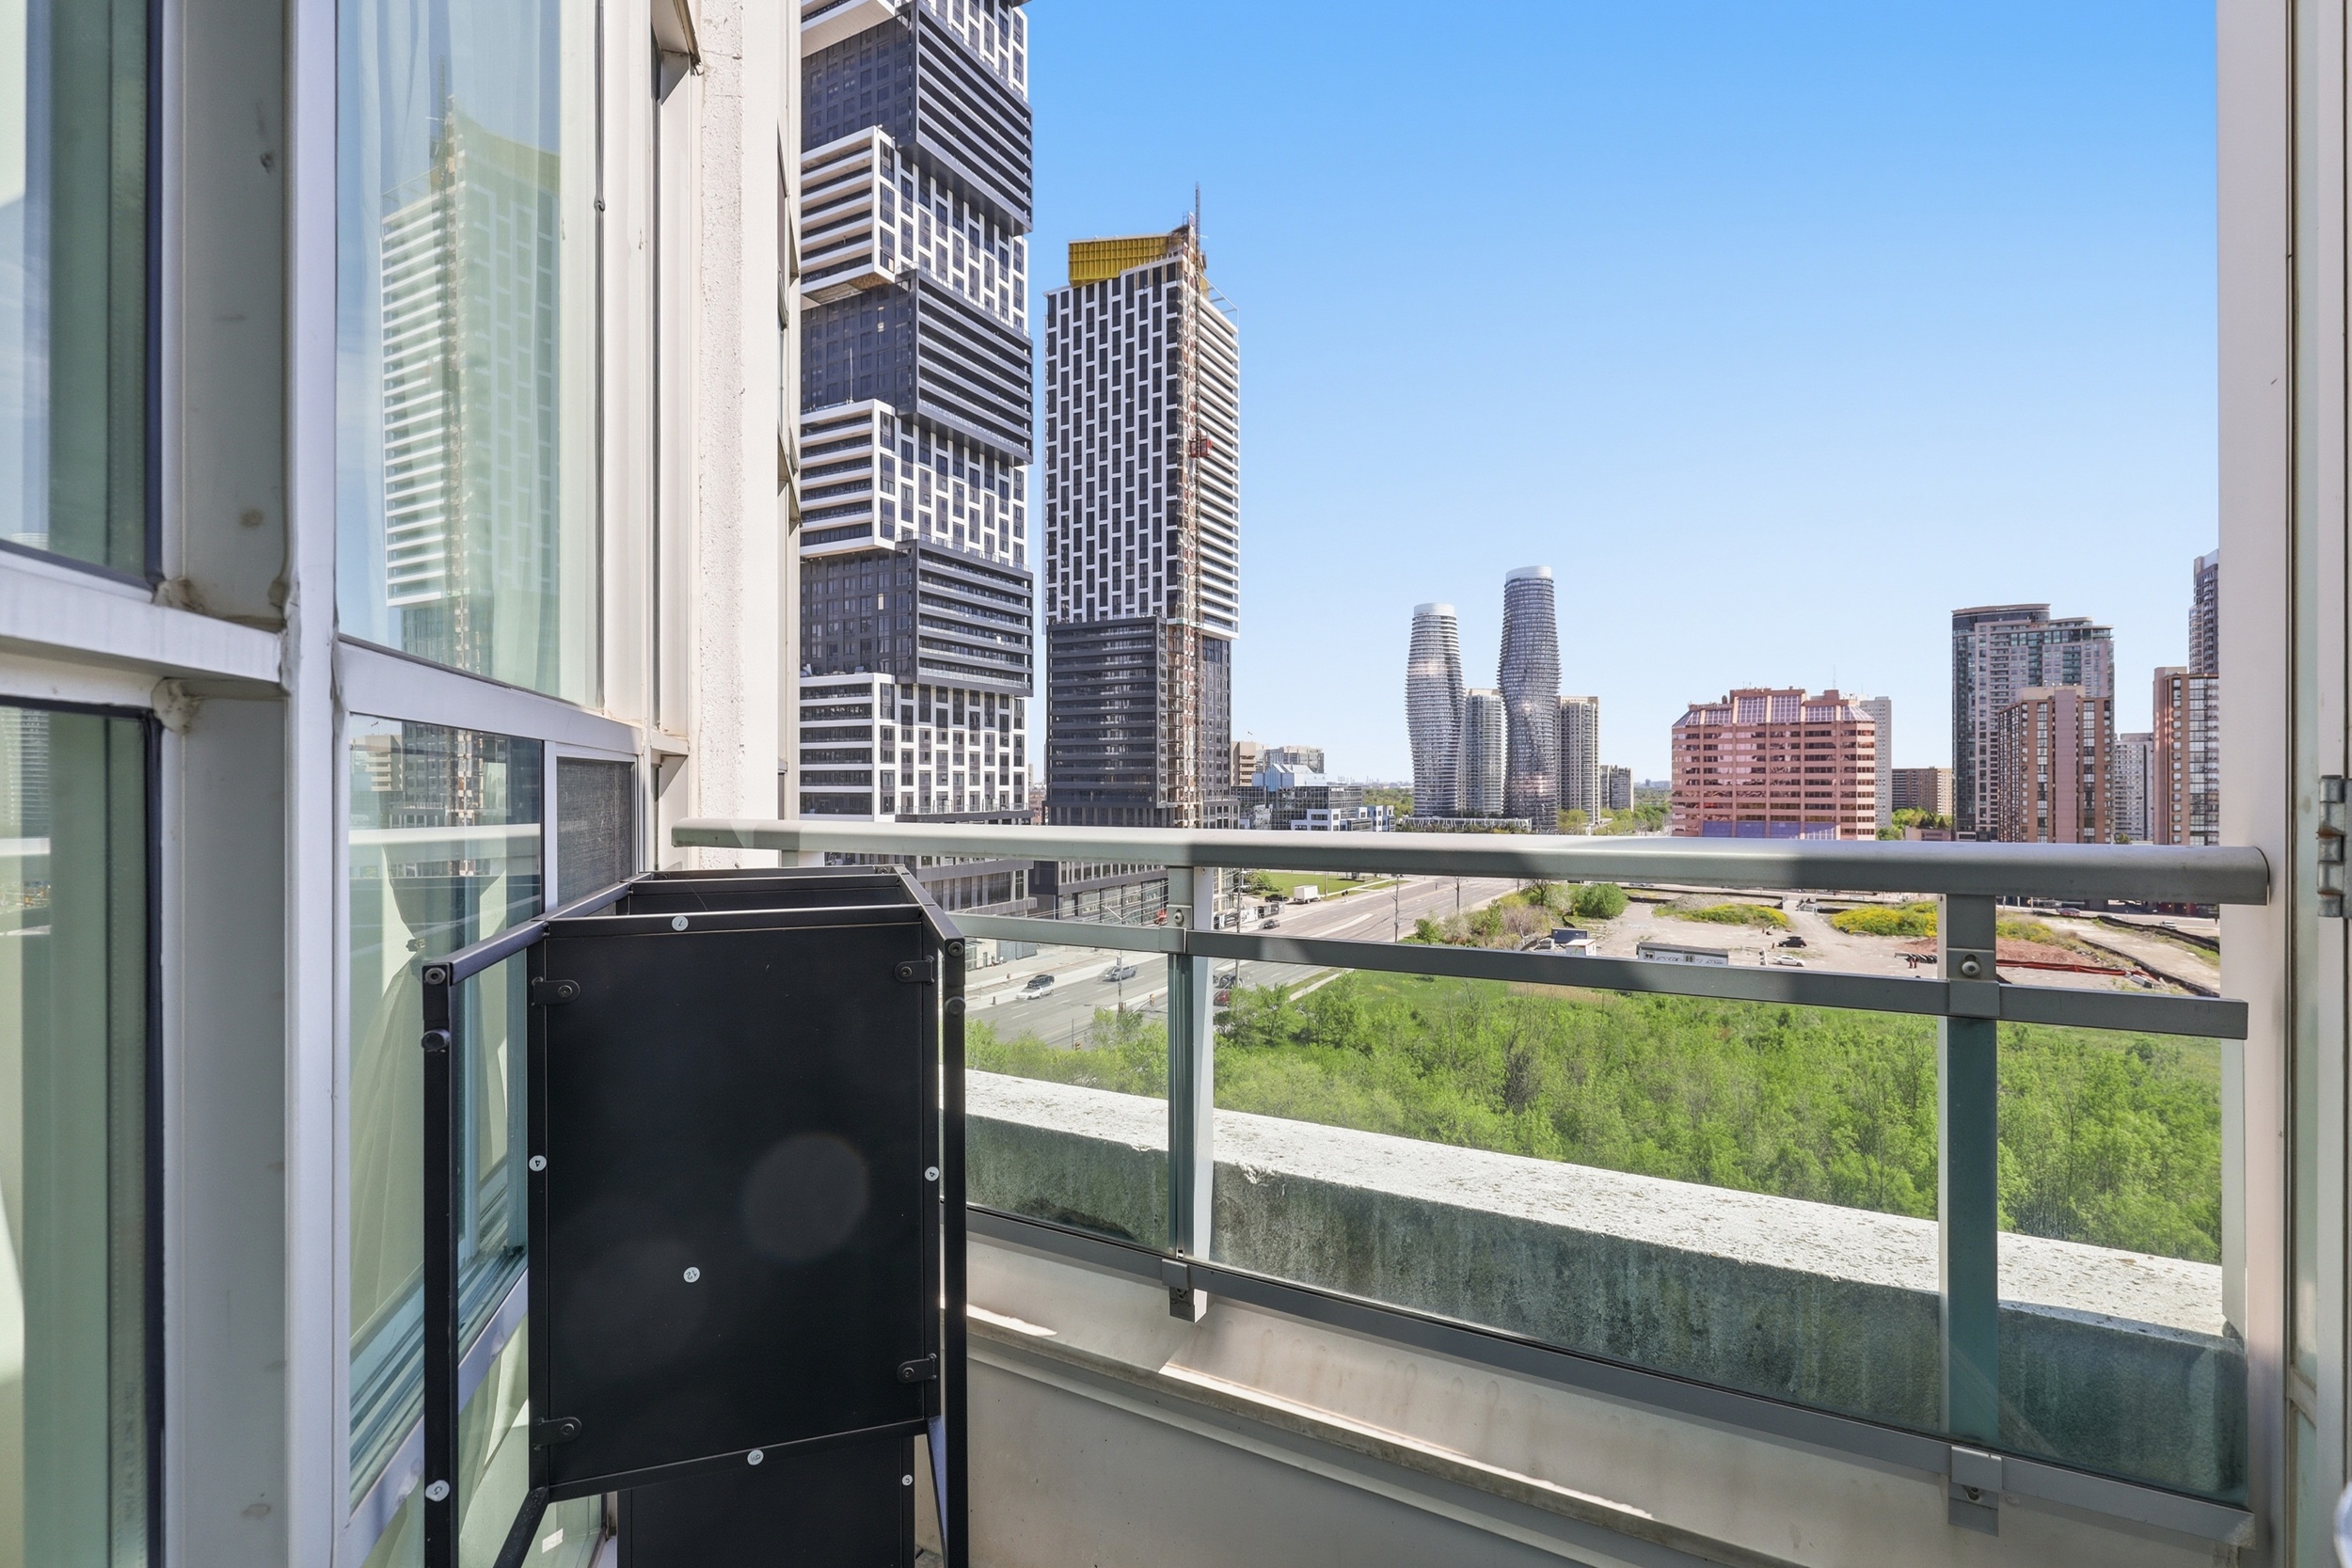
Most people reading about Toronto real estate get hit with city-wide averages or “hotspot” lists that gloss over the local story. Toronto is made up of micro-markets. W10 isn’t supposed to show this much price pain, especially when places like High Park still have lineups at open houses. Sellers outside the area might hold onto old beliefs. Meanwhile, buyers get nervous seeing west Toronto lose ground and wonder if they’re about to buy into a falling knife.
The standard advice is to look at city numbers. But here is the fence: you need to watch your actual district. W10’s trouble isn’t from massive overbuilding or a glut of investors, the way some condos in the rest of Toronto are. It’s about fewer buyers showing up, maybe pricing fatigue, maybe people holding off for even deeper discounts. In E07, it’s sluggish demand after big pandemic-era jumps. And W01? Higher competition, but not enough high-earning buyers to keep prices flat.
Thinking about selling your home?
Get a free, no-pressure valuation from a GTA realtor who tracks this market every day.
The risk is falling into the citywide trap: making a decision based on averages that hide pockets of real risk. Wait too long, and you might lose your edge. Jump too soon based on the wrong signal, and your home could sit with no offers for months.
This break between what the headlines say and what the districts report means buyers and sellers are caught flat-footed. Stay with me, I’ll show where the real answers live.
Looking at the Numbers Differently: Why District Data Wins
Here’s one thing the data makes clear: you can’t just wait for a market-wide “bottom.” It’s not working like it did in 2017 or 2020. Now, you see huge swings between districts. In W10 (think streets near The West Mall and Kipling), the benchmark price for homes in May 2024 is down over $130,000 from just last spring, according to Toronto Regional Real Estate Board numbers. Compare that to W01, where despite a nearly 70 percent jump in sales activity, sellers are shaving ten percent off 2023 listing prices just to land a deal.
Why this matters: when you track the numbers by district, not just the whole city, you see the clues before most people. If you’re selling in W10, waiting for a “GTA bounce” could end up costing you another five digits. But if you’re buying in, say, E07, timing and negotiation play out totally different.
Here’s where this approach differs from most Toronto real estate advice: the big portals and broadcast news won’t tell you that three districts back-to-back are now leading price drops, each for their own reason. Most people rely on averages. But as with the seasons, where one side of the street gets more sun and the other stays muddy for weeks, the real story is granular and close-up.
Loss framing in action: last time this happened, lagging sellers in W10 who waited for spring buyers ended up trimming $50,000 to $70,000 from their original ask, some never landing a deal at all by August. Doing nothing carries a cost, even if it feels safer short-term.
But the upside: watching your district, not just the whole city, can save you from surprise price drops, or help you spot a saving before it disappears. Up next, I’ll sketch out what buyers and sellers stand to gain by paying attention to local shifts this year.
The Real-Life Benefits: Getting Ahead of Toronto’s Market Moves
This hyper-local approach puts you ahead. If you’re selling in W10, tracking your own district shows you when actual buyers are turning up, or not, so you can reposition faster and avoid painful price chops. If you’re looking to buy in High Park (W01), knowing sales activity is up (from 78 sales to 132 in May year-over-year), but prices are still lower, lets you negotiate hard with tired sellers who thought 2022 would last forever.
The district numbers give you early warning. You spot when listings start lingering, or when price drops accelerate. You’re not blindsided by a slow trickle of inventory. It’s the real way in so you can make moves before the big adjustment comes. If you ignore it, you risk missing your window, either to get out before prices slide again, or to buy before things turn around in your pocket of Toronto.
So you can…remove as much guesswork as possible and use the data that’s actually affecting your block or building, not someone else’s.
For buyers from Mississauga or Vaughan looking at Toronto, these lessons hold. The same logic applies to any GTA patch. If you track your own district data, you get more lead time to adjust your game plan before the crowd. Still wondering how to map out what to do next? I’ve got a step-by-step, and a few more surprises from inside the W10 numbers, coming up.
Your Local System: Reading Toronto District Numbers Without Guesswork
- Pinpoint your patch. Use tools from Toronto Regional Real Estate Board (TRREB) to pull your exact district. For example, W10 covers Alderwood, Long Branch, and part of Etobicoke. W01 marks High Park and Swansea. E07 tracks along Steeles and Midland in Scarborough.
- Compare sales and price year-over-year. Look for both volume (number of homes sold) and price change. W10 down 10 percent in sale price, W01 up 69 percent in sales but down 13 percent in price, E07 dropping almost 18 percent in price.
- Check inventory and time on market. More listings with slower sales? That’s where price drops snowball. In W10, days on market grew by three weeks in May alone. E07 properties are lasting longer because demand dried up.
- Watch list price versus final sale price. Getting close, or are sellers slashing last minute? In these districts, most homes sell well below original list now, sometimes by $50,000 or more.
- Layer in rate and macro moves. Interest rates may edge down, but unless buyers re-enter fast, the local effect can lag by months.
- Sketch the next quarter, not just the next week. This market moves slowly until it moves suddenly. Catching the curve early (when your district starts falling behind neighbouring ones) gives you more room to act while choices are still up.
Every step keeps the focus just granular enough to cut through the noise but wide enough to avoid missing the next district bubbling up, or cooling off fast, like W10 just did.
Want a deeper breakdown with your exact street or area in mind? Next up, you’ll see how to get tailored insights or line up a one-on-one call about toronto district real estate and the hidden patterns moving your sale or purchase in Etobicoke, High Park, Scarborough, and across the GTA.
Next Steps: See What Your District Is Hiding
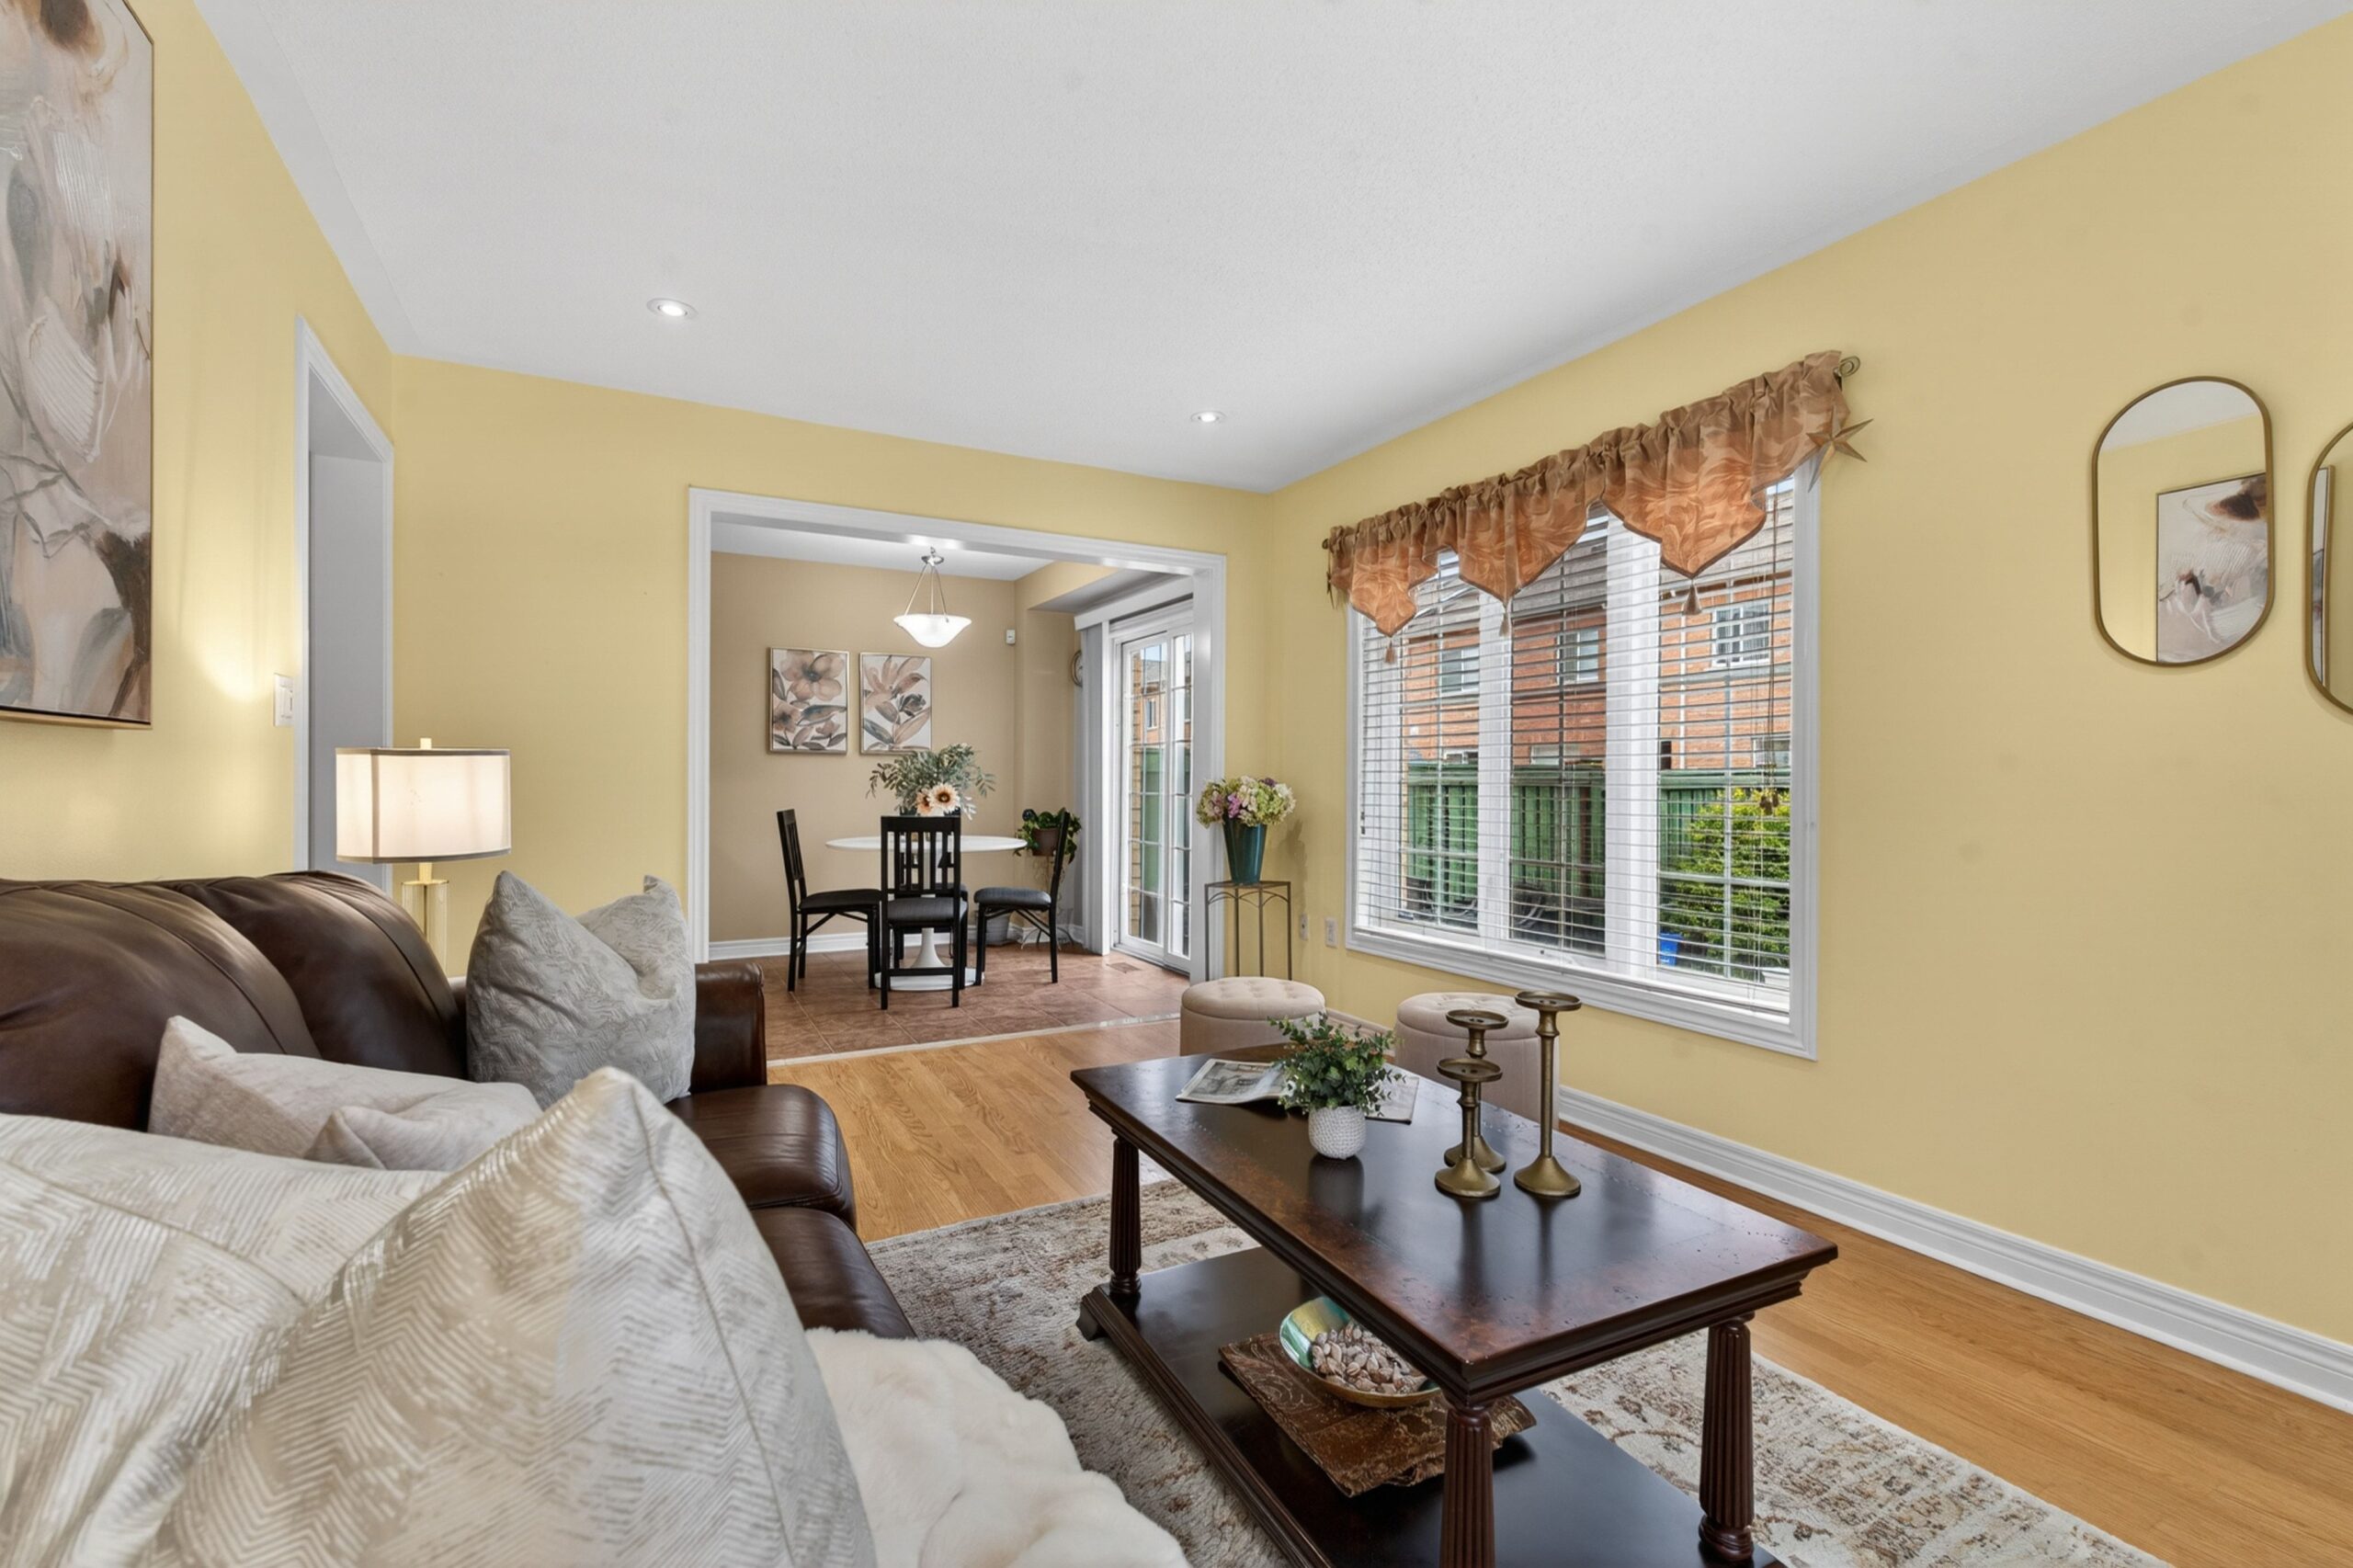
This year, toronto district real estate is showing splits between neighbourhoods in a way that’s flying under the radar for most. If you want to know how your street compares, or how fast buyers are really moving where you live, start with local numbers. Every edge counts when $100,000 swings are possible inside one season.
I cover these trends every week across Toronto and the GTA. For more on how your home or search fits into the ups and downs in W10, E07, or W01, or if you need a direct look at your area, check out my GTA real estate agent guide.
If you have district-specific questions or want a one-on-one walk-through of your neighbourhood’s stats, get in touch with me or book a call.
Dig deeper next: see exactly what happens when Toronto home sales stall in the next phase up the ladder, in Toronto Housing Market Correction 2026: What Phase Two Really Means and what sellers try when properties won’t move, in Why My Toronto Home Isn’t Selling: Four Fixes That Matter.

Sales Representative | Robbio Nicolle Real Estate Team at Real Broker Ontario
Halton Hills realtor covering Georgetown, Milton, Mississauga, and the wider GTA. Data-first, no hype. Featured on YouTube at The Market with Mats Moy with 500K+ views.